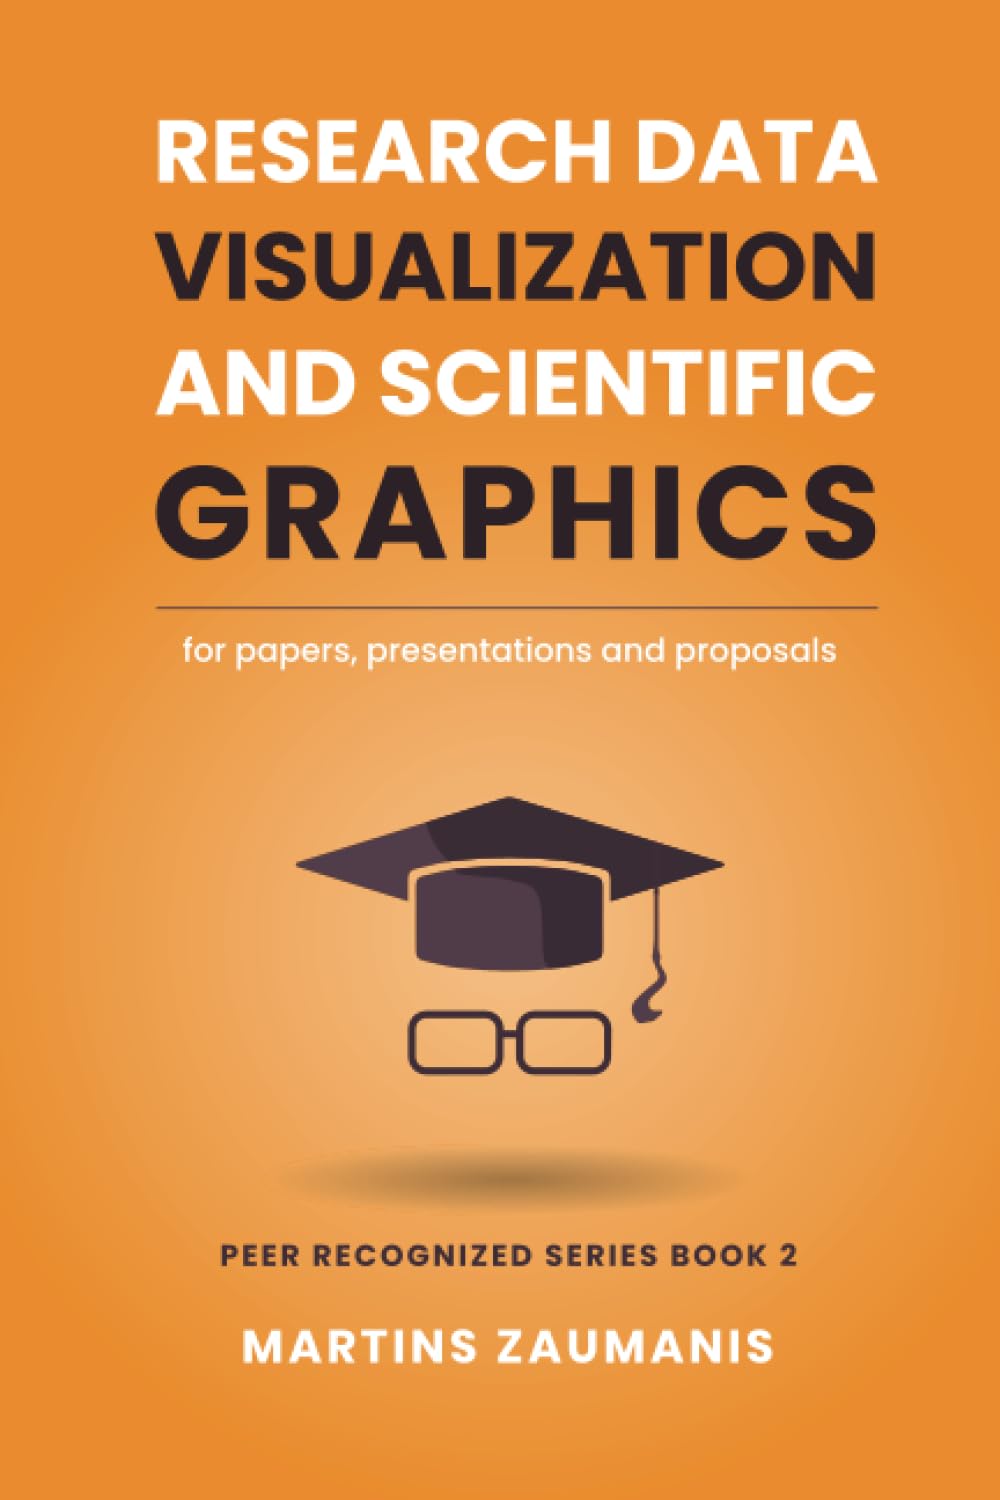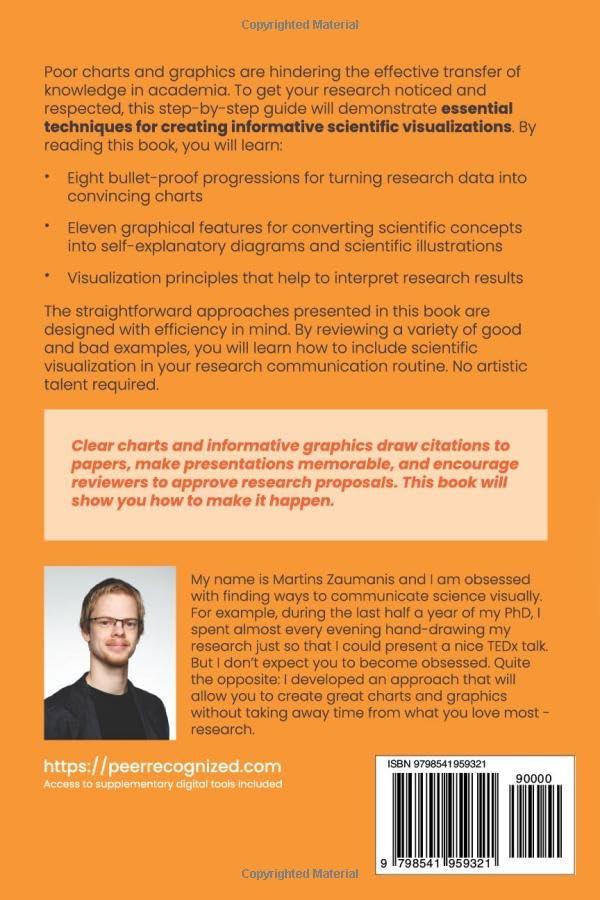


Research Data Visualization and Scientific Graphics: for Papers, Presentations and Proposals (Peer Recognized)
R**
Great summary a data visualization practices
This book is a great review of the basic principles of data visualization best practice. This small book covered all the same principles as a graduate level course I took in data viz last year in a fraction of the space. Highly recommend as a reference for anyone seeking to improve their data viz skills!
A**R
1 stars: No complaints
Needs improvement!
A**S
Excellent work!
I am a Grad student at UIUC, and my research is focused on Flexible Pavements. I am happy to share that I have finished reading your first two books. Firstly, thank you! You have done an excellent job.I read a tweet a few years ago, "140>280." I had a hard time interpreting what it actually meant. Then I went to one of the explanations, and the idea was about "simplicity." Twitter had 140 as the tweet limit earlier, and now it has been changed to 280. If you can say something with fewer words, in a simple manner, and accurately- that goes a long way.Since that day, I have searched for such authors/people who have this art of breaking down complex things, and you are one of them. Glad to see that you work in the same industry. I wish you all the best. Keep up the excellent work!
G**A
Great book for scientists who want to improve their visual communication skills
This is book is really great and provides the basics of data visualization along with other visual tools that will help scientists to communicate better their results.As an introductory text is very useful. However, as the author mentioned in the last sections, if you have particular interest on how to apply these techniques or use an specicif tool, you should consider to look other resoruces because this book is going to show only the big picture. Regardless of this, I think that the book would be an inspiration for those scientists who believe that visuals matter.
K**R
Great insights
Thank you so much for your book series! I read the first two e-books in the last weeks and they are already helping me for my PhD. Thanks a lot!
C**N
Great to make beautiful and self-explaining figures
Thank you very much for your "Peer recognized" book series. This book unlocked my understanding about the need to "convey a message" and not just "describe". They brought my ongoing paper to another level of clarity.
M**A
good book for phd students who have confusion to elaborate their research data
The book is must for ongoing phds and ma students who have doubts in how to represent and interpret the research data. The sections of illustrations; importance of schematic; generic figure to explain the importance of the research topic, copyright information and drawings are very well explained. The authors makes good effort to focus on data in concise manner. A one day read for the researchers. Looking forward for future books of dr. martins !!!
M**A
Highly recommended!
Unlike other dataviz books, this one is written specifically for scientists by a scientist. I have read other books on the topic and this one resonated with me the most because of the many examples from research papers, proposals and conference presentations. Most other books are business oriented and can feel too detached at times for what researchers need. What's important, there are also examples of what not to do (and why not).A pleasant surprise was the additional tools included.Highly recommended!
Trustpilot
2 weeks ago
4 days ago